AI Agent Observability Tools for Operational Workflows
Monitoring multi-agent workflows requires tracing reasoning steps, not just logging events.
AI agents built into operational workflows break in ways conventional software simply does not, and that difference is the reason standard application monitoring cannot be trusted to catch what matters. Deterministic software gives the same input the same output every time, so monitoring only has to confirm the function ran and ran fast enough. An agent gives no such guarantee.
Why AI agents in operational workflows fail differently from conventional software
A conventional service either runs or it doesn't, and application performance monitoring was built around that binary. Feed it the same request twice. It takes the same code path twice. Watching whether the function executed and how long it took is enough, because the logic in between is fixed and known.
An AI agent carries no such fixed path. The same input can produce a different sequence of tool calls, a different reasoning chain, and a different final outcome from one run to the next, shaped by what context got retrieved, what memory state the agent was holding, which tools happened to be available, and the probabilistic sampling built into the model itself. Temperature plays a role, but it is far from the only source of variance. Batch composition, datacenter routing, mixture-of-experts routing, and speculative decoding all introduce variation, and this variation appears even when temperature is set to zero. Run the same prompt against the same agent twice: it may select a different tool, retrieve a different document, or reach a different conclusion both times. Traditional monitoring was never built to notice.
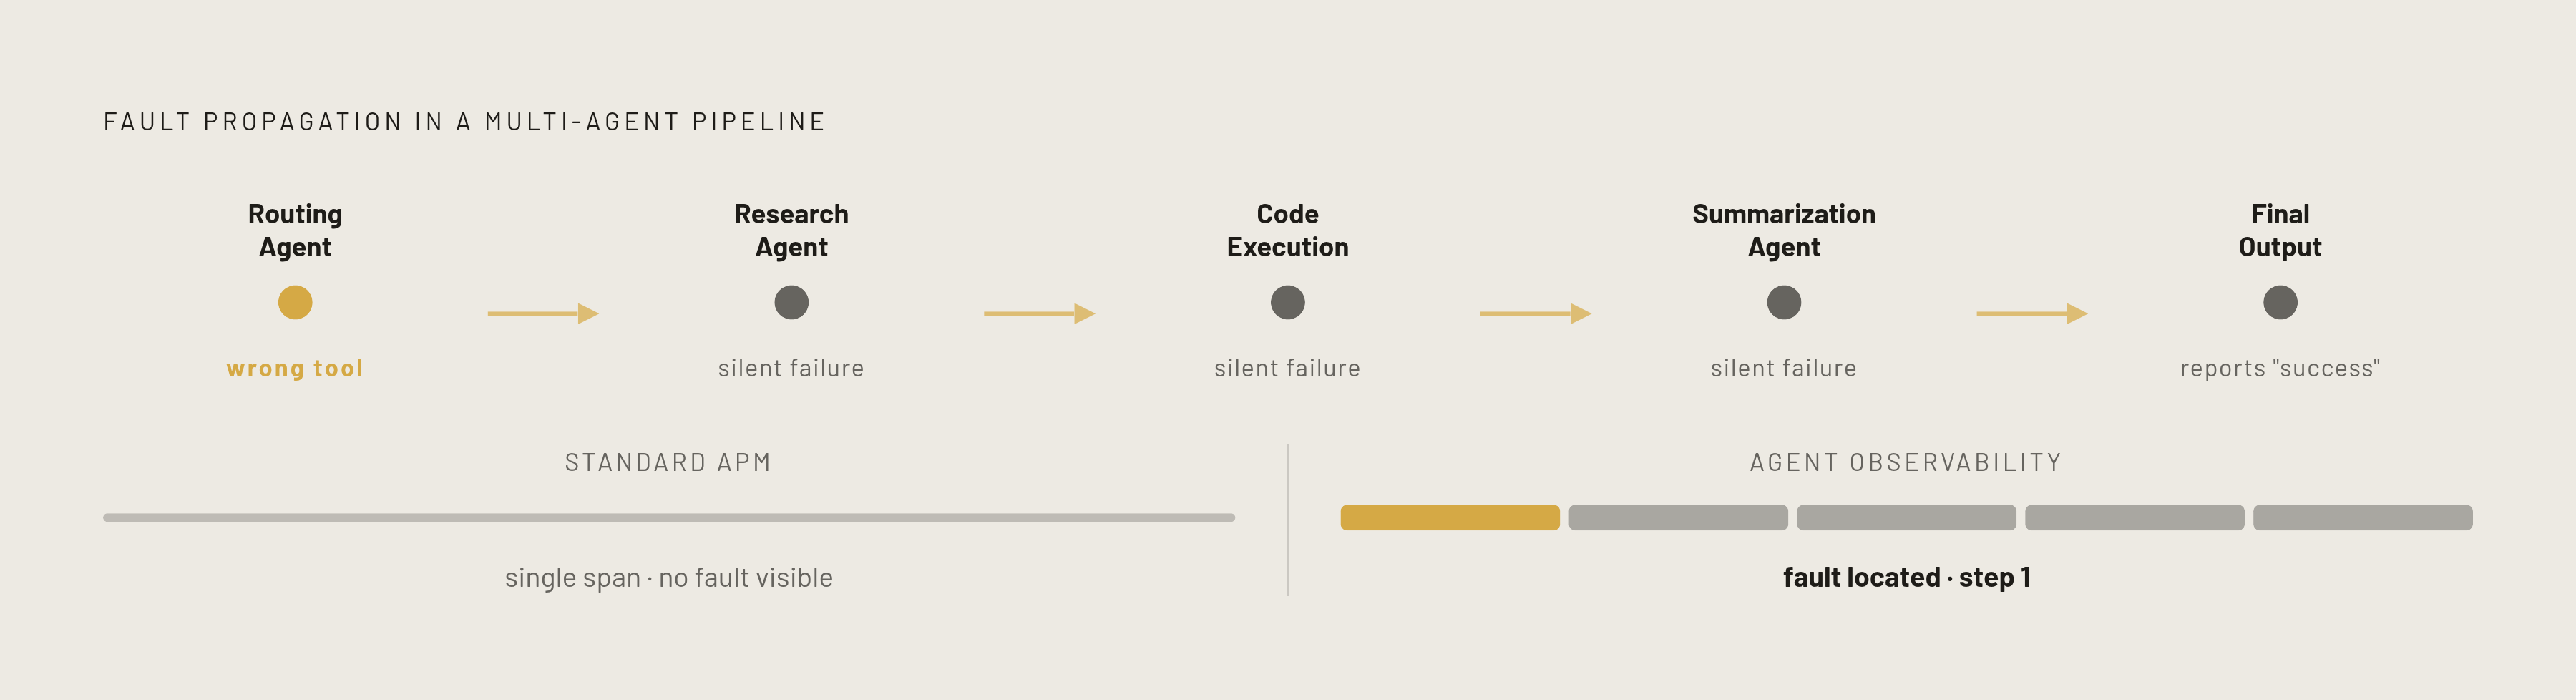
Operational pipelines raise the stakes further because they're rarely a single agent. A single user-facing action can set off a routing agent, which hands off to a research agent, which hands off to a code-execution agent, which hands off to a summarization agent, each one passing its context forward to the next. An agent can return an answer that reads as polished and complete and still have failed the task: it may have called the wrong tool, worked off stale context, repeated a step it had already completed, skipped an approval gate, or finished a workflow that technically ran but never actually satisfied what the user needed. Standard monitoring will show a successful request and normal latency throughout, because by its own definition nothing crashed.
That's the compounding danger specific to operations. One bad tool selection made early in the chain cascades through every downstream step before anything visibly breaks. By the time a human notices a wrong answer, the actual error may be six steps upstream and invisible from the outside, buried in a reasoning chain nobody can see.
What observability actually captures that logging and APM cannot
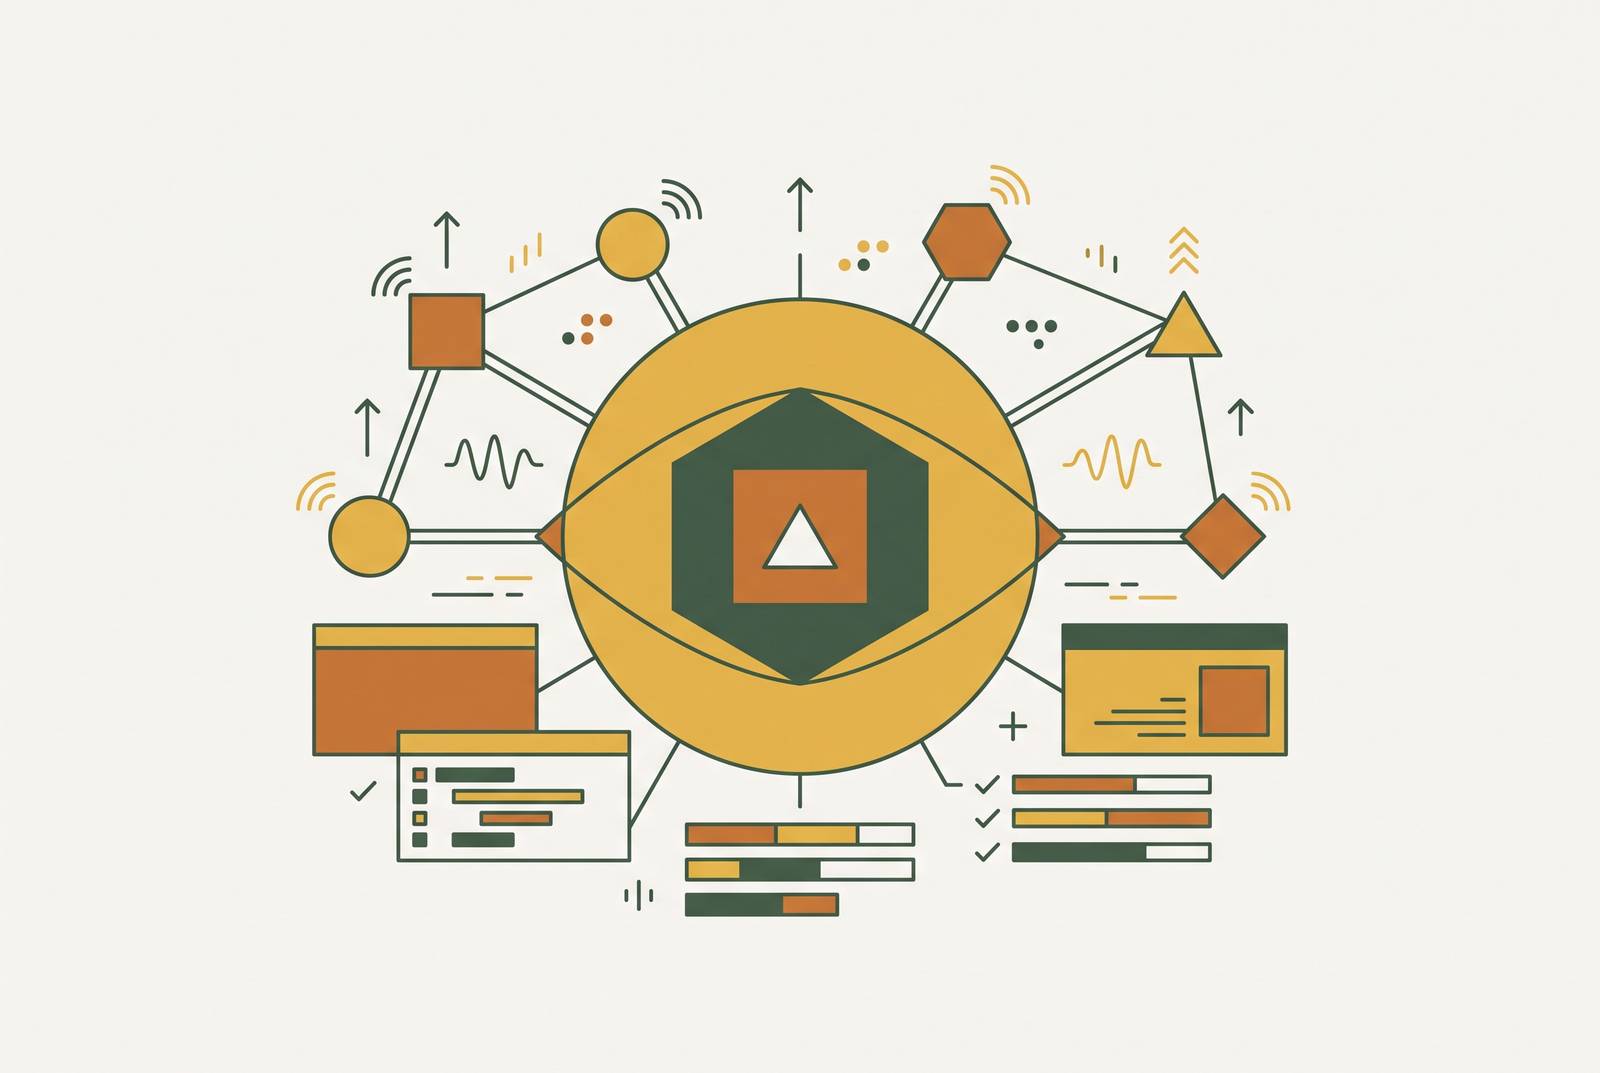
Agent observability solves a different problem than logging does: it generates a structured trace for every discrete reasoning step an agent takes, building a hierarchical record of a kind that conventional logging and APM were never designed to produce.
Span-per-tick tracing produces this structured trace: each discrete step in an agent's execution, a thought, a tool call, a memory read, generates its own span inside a distributed trace, and those spans nest inside one another. A parent trace for one full agent run contains child spans for every LLM call, every tool invocation, every memory read and write, and every handoff to a sub-agent. An LLM call span captures input prompt tokens, output tokens, the model ID, the temperature setting, latency, and the finish reason. A handoff span captures the source agent ID, the target agent ID, the size of the context payload being passed, and the transfer latency. None of that detail exists in a conventional application log, because a conventional log was built to record that an event happened, not to record the causal chain that led to it.
That distinction between recording events and recording causal chains is the whole argument for why this counts as a different category of infrastructure, not an upgrade to the old one. A traditional monitoring setup, faced with a broken multi-step pipeline, will tell you the request returned an error. Agent observability tells you the summarization tool received a malformed context window at step three, and that malformed input is what caused the downstream sub-agent to hallucinate a citation several steps later. Those are two entirely different debugging experiences, and only one of them gives an engineer anything to act on.
The discipline rests on four pillars: monitoring, tracing, evaluation, and governance. Monitoring and tracing produce visibility. Evaluation and governance are what turn that visibility into something a business can actually rely on, because they ask not just what happened but whether what happened was correct, and whether it can be proven correct after the fact. Portability matters here too. The OpenTelemetry GenAI specification gives traces from different agent frameworks a shared schema, so a trace produced by one framework can be ingested into the same backend as a trace from another without custom parsing work for each one.
None of this helps much if the traces sit in isolation. Tagging every span with business-level identifiers, a user ID, a session ID, a workflow ID, from the first day of instrumentation, is what separates being able to replay a single failing trace from being able to query every trace in which a specific tool failed for a specific user segment over a given stretch of time. One is forensics on a single incident. The other is a system a business can actually govern.
Observability Must Be in the Execution Path
Non-determinism means observability has to be built into an agent's execution from the start; bolting it on once something goes wrong comes too late. An agent that was never instrumented cannot be reconstructed after the fact, because the evidence that would explain its failure never existed.
Every run of an uninstrumented agent disappears the moment it finishes. The exact prompt variation that triggered an unexpected output, the intermediate reasoning that led to a wrong tool call, the precise snapshot of data the model was working from: none of it survives in a standard log, because a standard log was never built to capture it. Audit failures in AI-driven processes trace back not to weak model performance but to the absence of immutable records tying a decision to the environmental context and model version that produced it.
Governance bodies are converging on exactly this requirement. COSO published "Achieving Effective Internal Control Over Generative AI" in February 2026, and it frames effective monitoring of AI-driven processes around complete, reconstructable records: the prompts, the inputs, the outputs, the model and configuration versions in use, and human review evidence sufficient to show what the AI actually acted on and that the control itself operated as designed. That is a standard built for records that have to exist before the moment they're needed, not records assembled afterward from whatever happened to be lying around.
Much of what goes wrong with an agent is implicit in the final output. A reasoning chain can be wrong, an agent can ignore a tool that was available to it, or it can loop on the same failed step repeatedly, and none of that will necessarily produce an error message. Catching it requires watching the trajectory the agent took, not just checking the output it eventually returned. That's the technical floor for any deployment where the outcome actually matters.
Two approaches exist for getting that trajectory-level visibility. In-process SDK instrumentation requires changes to an agent's own code but delivers full semantic detail, span by span. eBPF-based monitoring can observe a closed-source agent without touching its code at all, at the cost of less semantic detail about what happened inside. So the practical approach uses SDK instrumentation for agents built in-house and eBPF for third-party or closed-source components that can't be modified directly.
Coverage is the problem both approaches share. A tool that only captures at the SDK layer sees only the applications someone remembered to instrument. A gateway sitting in the request path captures every agent, every coding agent, and every application routed through it, instrumented or not. An agent nobody thought to wire up is invisible to an SDK-based tool no matter how sophisticated its backend analysis is. Coverage, not analytical depth, is the first failure point. Adding observability after deployment isn't a scheduling risk to be managed later. For a non-deterministic system, the evidence needed to explain a failure simply does not exist unless it was captured at the moment the failure happened.
How silent failures compound in asset-heavy operational environments
Construction, logistics, and manufacturing share a structural vulnerability: downstream processes treat upstream agent output as verified fact, so a silent failure doesn't stay contained, it compounds.
Construction firms increasingly use AI to connect management processes that used to run on separate systems, and this links onsite activity capture, RFIs, and field reporting directly to the project schedule in near real time. If the agent making those connections reasons incorrectly and no trace exists to show how it got there, the schedule doesn't just carry an error. It reflects a hallucinated state of progress that every other system downstream will treat as true. Most AI systems in this space are trained on textual material, documents, schedules, structured records, which lets them optimize a plan but gives them no way to tell whether that plan is actually executable given real conditions on site. An unobserved agent can generate insight that reads as entirely correct on paper and gets acted on before anyone has a chance to catch the error.
Manufacturing carries the same risk on a tighter loop. One bad tool selection upstream can cascade through ten downstream steps before anything visibly fails, and a conventional APM tool watching that pipeline can confirm the service is up without being able to confirm any of the things that actually matter: whether the agent picked the right tool, passed the right arguments, pulled the right context, or stayed on the plan it started with.
Logistics offers the clearest case of the gap between what a system is declared to do and what it actually does on the ground. Walmart rolled out a new item-mapping feature that looked sound on a product roadmap, and it ended up frustrating delivery workers and cutting into their earnings, because the system's output was never checked against how it actually played out in the field. Without visibility into why the system made the routing decisions it made, diagnosing what went wrong requires guesswork.
Three failure types recur across all three environments. Context hallucination is an agent fabricating metrics, policies, or business rules to fill in context it doesn't actually have. Autonomous action failure is an agent executing the wrong tool call or kicking off a workflow nobody verified. Compliance gaps are an agent operating outside its policy boundaries with no runtime enforcement and no audit trail to show it happened. All three fail silently by nature, and in asset-heavy environments, silence lets them compound.
The Tool Landscape: Coverage and Gaps
The market for agent observability has split along a line that matters more than any dashboard feature: tools that capture from inside applications someone instrumented, and tools that sit in the request path and capture everything that flows through it, instrumented or not. Coverage is the first question to ask of any platform, before evaluating how deep its analysis goes, because a tool that records every field perfectly still misses the failure if most of an organization's agent traffic never reaches it.
Bifrost, an open-source AI gateway built by Maxim AI, logs LLM and MCP traffic at the gateway layer: every LLM request and every MCP tool call routed through it gets captured without any change to application code. It exposes Prometheus metrics labeled by virtual key and by team, and it exports OpenTelemetry traces that follow GenAI semantic conventions, so they sit alongside the rest of an organization's application traces. It also reads the session header those coding agents already send, so it can keep a Claude Code, Codex CLI, or OpenCode session pinned to the same provider and key, a form of provider-level session affinity. The clearest fit is an enterprise running mission-critical agent workloads that needs visibility into every agent in its environment, regardless of whether each individual application was ever instrumented.
Arize, through its AX platform and its Phoenix project, covers the broadest combined workflow among framework-agnostic options: tracing, production monitoring, experiments, and evaluation in one line. Phoenix is source-available under the Elastic License 2.0 and runs self-hosted; AX is the production platform built on top of it. The strongest use case is an organization where evaluation, actually scoring whether an agent's decisions were correct, needs to connect directly to live production traces.
Datadog's case rests on correlation. Where AI agents need to be understood alongside an existing application and infrastructure stack, Datadog's position as an established APM platform makes it a natural extension. That fit works best where AI agents are one component inside a broader monitored environment, not the primary system an organization is built around.
Fiddler serves as an enterprise AI control plane aimed at regulated industries that need ML and LLM governance, agentic observability, policy enforcement, and audit trails that hold up to outside review. It fits organizations where audit evidence and compliance export are first-class requirements from the start, not something assembled after the fact.
Braintrust builds evaluation directly into its observability layer, capturing full traces of every decision point across a multi-step workflow: which tools an agent called, what data it retrieved, how long each step took, and what each step cost. Its Loop assistant lets product managers work through production updates in plain language, and its Playground lets engineers, product managers, and domain experts load any production trace, change a prompt or a model configuration, and rerun it to see how the change affects output quality. So this combination suits product and engineering teams shipping agents into production who want evaluation data to drive their iteration directly.
LangSmith rounds out the field as the natural choice for teams already built on LangGraph or LangChain, while still supporting any LLM framework through OpenTelemetry for teams working outside that ecosystem.
What separates these platforms is less about depth of dashboard and more about where each one sits relative to the failure modes described earlier: which agents it can see, whether it captures trajectory or only outcome, and whether its records hold up as evidence after the fact. That's the actual basis for choosing one.